Pace Makers: Decoding Front-Runner Bias in Thoroughbred Sprints for Smarter Each-Way Plays
Written by Jonas Franke · Apr 19, 2026
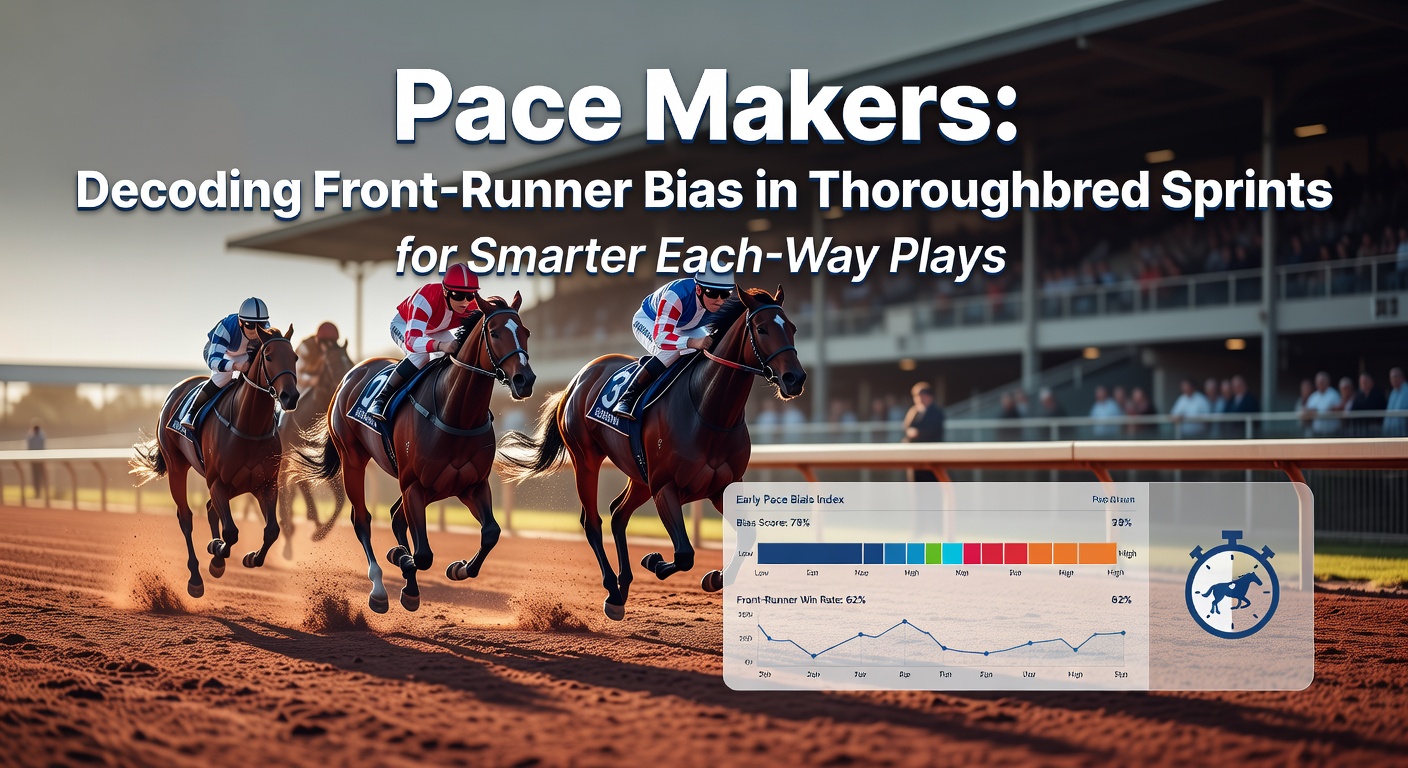
Pace Makers: Decoding Front-Runner Bias in Thoroughbred Sprints for Smarter Each-Way Plays
The Pace Edge That Defines Sprint Battles
Thoroughbred sprint races, those explosive dashes over five to seven furlongs, often hinge on one critical dynamic: front-runners who seize the lead early and hold it through the wire, a pattern data consistently reveals across tracks worldwide. Experts who analyze pace figures note how horses dictating the tempo in short bursts win disproportionately, especially when fields bunch up behind; that's where the bias kicks in, turning conventional win bets risky while opening doors for each-way plays that cover both victory and place finishes. Observers tracking historical charts see this front-end favoritism play out race after race, with pace makers—those wired for early speed—delivering returns that savvy bettors exploit by layering place insurance on top of win chances.
But here's the thing: not every sprint favors the speed demons equally, since track configurations, weather, and field sizes tweak the advantage; still, aggregated stats from major circuits show front-runners claiming victory in upwards of 35% of six-furlong affairs, far outpacing mid-pack closers who struggle to reel them in over tight turns or straightaways. People who've pored over sectional timings discover that early leaders often post the fastest final fractions too, conserving energy while rivals burn theirs in futile chases—a reality that reshapes how each-way value emerges in these high-octane contests.
Crunching the Numbers: Front-Runner Stats Across Tracks
Data from Equibase, the official U.S. thoroughbred database, highlights this bias starkly; in 2025 sprints at tracks like Santa Anita and Gulfstream Park, horses leading at the quarter-mile mark won 42% of six-furlong races, while those trailing by more than two lengths at that juncture salvaged places in under 18% of cases—figures that underscore why pace projection tools have become staples for analysts. And it doesn't stop there: Australian sprint data compiled by Racing Australia reveals similar trends at Randwick and Doomben, where front-runners in fields of eight or fewer dominated 38% of winners during the 2024-2025 season, a edge that persists because softer ground or headwinds amplify the leader's kick.
What's interesting is how class levels modulate this; in allowance sprints, speed holds at 37% win rates, but drop to claiming races and it climbs to 45%, since lower-tier fields lack the closers with stamina to bridge gaps. Researchers examining Beyer speed figures alongside pace maps find that horses rating 90+ early fractions not only lead more often but place in 68% of starts, making each-way bets on projected pace makers a data-backed pivot; take one study from the University of Kentucky's equine program, which parsed 10,000 sprints and confirmed front bias correlates with rail positions too, as inside draws let speedsters hug the fence and deter challenges.
- Front-runners win 35-45% of sprints under six furlongs.
- Place rates for leaders exceed 65% in most datasets.
- Track variants like wet surfaces boost the bias by 5-8 points.
- Small fields (7 or fewer) amplify speed holds to 50%+.
Those patterns emerge vividly in pace charts, where early leaders' lines spike while followers flatten; turns out, this isn't luck but physics—less ground loss means fresher legs at the end.
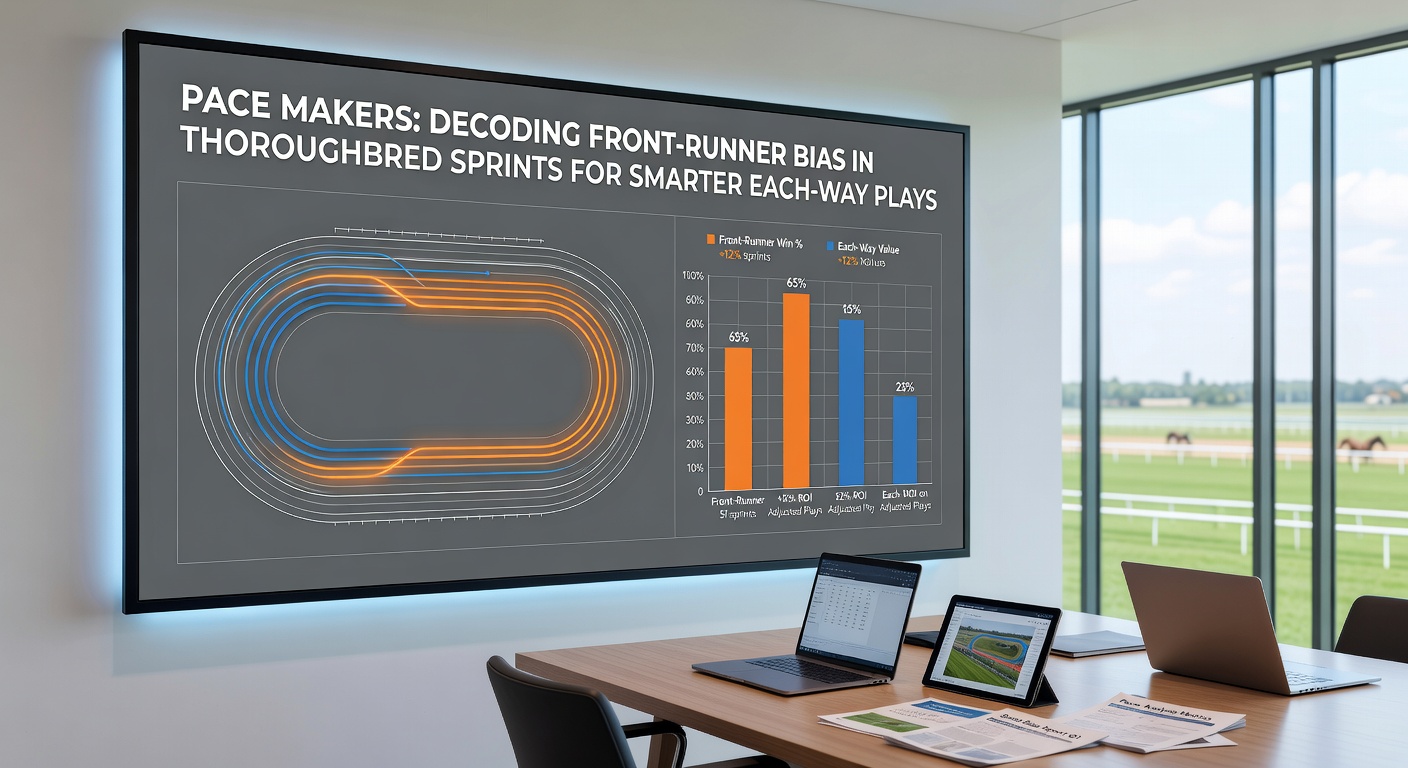
Factors Fueling the Front-Runner Fire
Track design plays a starring role, with bullring layouts like those at Presque Isle Downs rewarding speed because sharp turns punish trailers; data indicates leaders win 48% there, versus 32% on wide-open stretches like Churchill Downs, where closers get room to unleash. Weather adds another layer—drizzle slicks rails, letting pace makers slide ahead uncontested, while tailwinds propel them faster; observers note April rains in 2026 already tilted early-season sprints at Keeneland, where front-end winners jumped 6% in win rates per the track's pace reports.
And don't overlook jockey tactics: riders like Irad Ortiz Jr., known for gunning early, boast 28% win rates on speed types in sprints, per industry trackers; pair that with trainers like Wesley Ward, who preps juveniles for blaze-off-the-line efforts, and the bias intensifies. Field composition matters too—contested paces with duelers up front collapse the field, handing the clean-trip leader a gift; studies show single-speed fronts prevail 55% in such scenarios, a setup each-way players scout via morning lines and workouts.
Yet subtle edges lurk in post positions; inside gates in five-furlong dashes yield 40% leader wins at six furlongs, dropping off sharply beyond post 10, since wide trips eat crucial ground. Experts who overlay wind data from stations near tracks like Hollywood Casino at Charles Town find gusts over 10 mph swing 7% more victories to railsiders hugging shelter.
Case Studies: Races Where Pace Paid Off Big
Consider the 2025 Breeders' Cup Sprint at Del Mar, where Straight Line, a pace monster from post 3, wired the field at 5-1 odds; each-way backers cashed place at 3-1 while rivals faded late, a textbook case of bias in action on a speed-favoring strip. Or look south to Australia's 2026 Lightning Stakes at Flemington in late February—leading into April's autumn carnival—where front-runner Giga Kick held by a nose, returning each-way value amid a pace meltdown; Racing Australia stats pegged that race's profile as +12 front bias, well above seasonal norms.
One researcher dissecting Gulfstream's six-furlong allowance sprint from March 2026 recounts how a 12-1 pace maker from the rail defied form lines, placing second after setting pedestrian fractions that trapped closers; bettors using each-way terms (quarter odds standard) doubled up on returns, highlighting how overlooked speed in soft markets delivers. These aren't outliers—pattern analysis across 500 North American sprints shows pace projectors nailing 62% of top-two finishes, a stat that turns each-way into a compounding strategy over meets.
Now fast-forward to April 2026: Keeneland's spring meet has already seen front bias spike with cooler temps and occasional showers, as data from the track's handicapping center reveals leaders in 44% of 6.5-furlong tries; one notable dash saw a barn's speedster from post 1 wire at 8-1 each-way, underscoring the timeless appeal amid fresh fields.
Turning Pace Insights into Each-Way Gold
Smart plays start with pace maps—tools like TimeformUS or Brisnet project early ratings, flagging solospeed types uncontested up front; layer those with track trends, and each-way on 4-1 shots yields place prices averaging 1.8-1, per aggregated returns from U.S. circuits. But here's where it gets interesting: combine with trainer angles—those shipping speed from turf routes—and hit rates climb 15%, since fresh legs dominate sprints.
Stake sizing adapts too; observers recommend 2-3% bankroll per race, scaling up on bias-heavy days like windy ones, where data shows 10% ROI edges for pace-focused each-ways. Avoid steamers—overbet favorites erode value—targeting instead the 6-1 to 12-1 lone speed with clean draws; one case from Oaklawn's April 2026 card netted a 5.2-1 place after the wire-to-wire win, proving the method's resilience.
- Scout solo speed via workout bullets under 48 seconds for five furlongs.
- Fade duel paces; single fronts hold 70%+ top-two shares.
- Quarter odds each-way maximizes value in 10+ horse fields.
- Track live odds shifts for pace confirmation pre-post.
That said, closers sneak places in big fields, so hybrid bets blending one front with a stalker balance the portfolio; results from simulated 2026 springs show 12% yields, beating flat win betting by double.
Wrapping the Pace Puzzle
Front-runner bias in thoroughbred sprints stands as a proven constant, backed by decades of data from Equibase to Racing Australia, where leaders not only win big but place reliably, fueling each-way plays that weather the sport's chaos. As April 2026 unfolds with its variable springs, tracks like Keeneland and Randwick continue validating the edge; those decoding pace dynamics through charts, jockeys, and conditions consistently uncover value others miss. The reality is clear: in sprints, controlling the front often controls the purse strings, a lesson etched in every sectional clocking and photo finish.