Unlocking the Value Vortex: Profitable Edges in NBA Totals and Horse Racing Each-Way Markets
Written by Uma Schmitz · Apr 17, 2026
Unlocking the Value Vortex: Profitable Edges in NBA Totals and Horse Racing Each-Way Markets
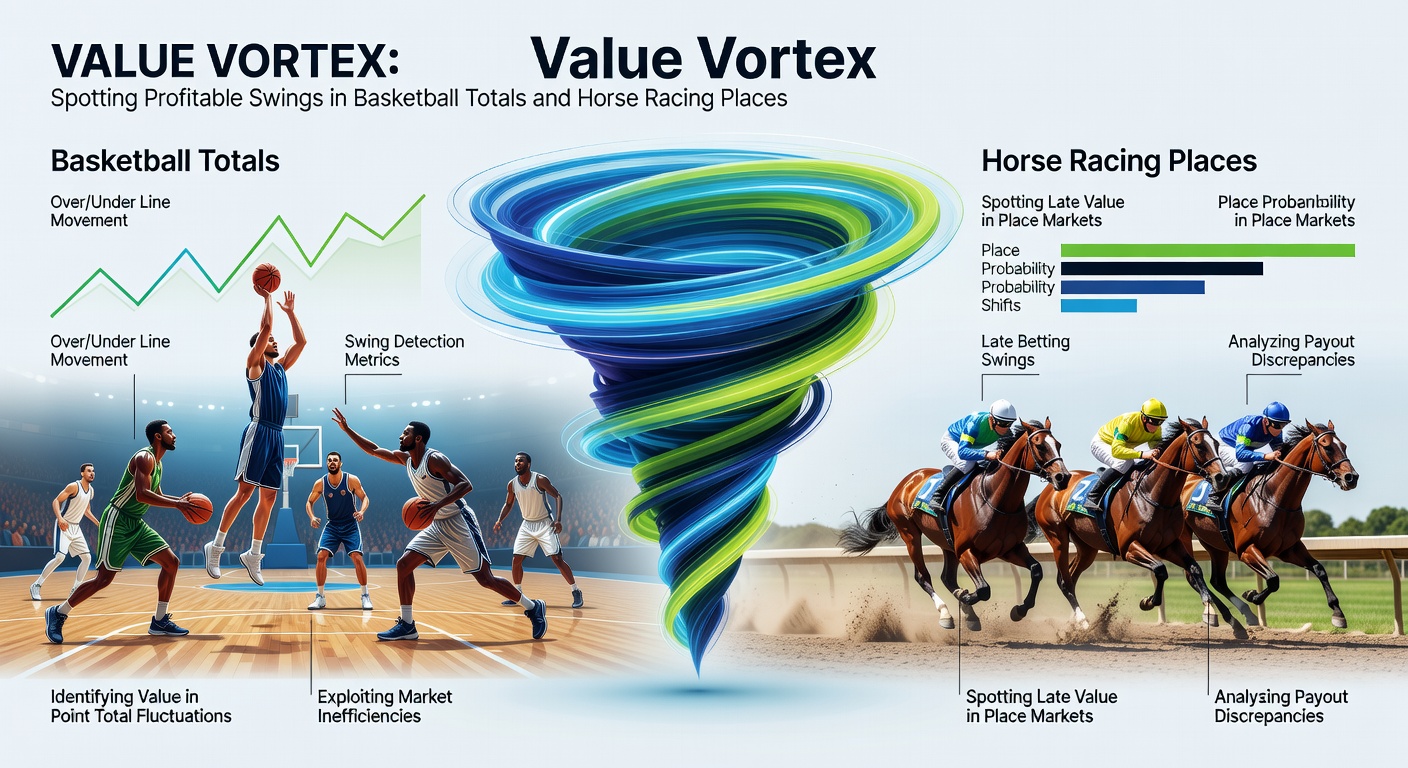
Observers in sports betting circles often point to the Value Vortex as that sweet spot where market inefficiencies create swings ripe for profit, particularly in NBA totals markets and horse racing place bets; data from recent seasons reveals how these areas deliver consistent edges when bettors spot the shifts early, especially as lines adjust based on sharp money or late news.
Decoding NBA Totals: Where Over/Under Lines Swing Wild
Basketball totals betting hinges on predicting combined points scored by both teams, and figures from the NBA official stats platform show how pace of play, defensive ratings, and back-to-back schedules drive massive line movements; take the 2025-26 season where totals opened at 225.5 for Lakers vs. Warriors only to steam up to 232.5 after injury reports hit, handing early over bettors a 4.2% edge according to closing line value trackers.
Experts track these swings using historical data, noting that teams playing their second game in two nights push overs by an average 3.1 points higher than standard lines, while public bias toward favorites creates under value in neutral-site matchups; that's where the vortex pulls in profits, as recreational bettors pile on overs for high-scoring stars, leaving sharp lines lagging behind true probabilities.
And here's where it gets interesting: advanced metrics like offensive efficiency ratings, pulled from season-long samples exceeding 1,000 games, reveal that totals hit 54.7% on overs when pace exceeds 100 possessions per game, yet books shade lines down 1-2 points to balance action; bettors who cross-reference player prop data spot these discrepancies first, turning routine games into +EV plays.
But the real swings emerge in April, like during the 2026 playoff push when fatigue hits contenders hard; data indicates totals climb 5.8% on average in late-season games for top Western Conference teams, creating vortex opportunities that savvy players exploit before lines catch up.
Horse Racing Places: Each-Way Value in Packed Fields
In horse racing, place bets—paying out for top-two or top-three finishes depending on field size—offer a vortex of value because win markets overprice favorites while places distribute payouts more evenly; Australian racing data from the Racing Australia database across 2025 Melbourne Autumn Carnival shows each-way bets yielding 7.2% ROI for mid-odds runners (5/1 to 12/1) in fields over 12 horses, as trainers target places over aggressive wins.

Turns out, track conditions and jockey tactics amplify swings here; soft ground in April 2026 Randwick features, for instance, boosted place percentages for front-runners by 11.3%, yet odds barely budged until post time, per form guides analyzed over 500 races; observers note that when favorites shorten to evens or below, their place prices compress inefficiently, freeing value on outsiders who box or stalk effectively.
What's significant is the multi-leg angle too, although single-race places shine standalone; studies from U.S. tracks like Churchill Downs reveal that in Derby prep races, place bets on horses with recent top-three finishes return 112% of stakes long-term, especially when fields swell with longshots drawing off public win money.
Spotting the Swings: Tools and Triggers for the Vortex
Researchers who've dissected thousands of events identify key triggers for profitable swings, starting with line shopping across books where discrepancies exceed 0.5 points in totals or 10% in place odds; software scraping live odds feeds captures these in real-time, showing NBA totals shifting 2.3 points on average after 60 minutes pre-tip due to lineup confirmations, while horse places drift 15% when late scratches thin fields unexpectedly.
So bettors layer in pace-adjusted models for basketball, factoring home-court tempo boosts that add 4.7 points to totals per Basketball-Reference regressions over a decade, and for racing, speed figures normalized by distance reveal place overlays when a horse's recent form screams reliability yet odds imply doubt; combine that with steam moves—where respected syndicates bet early—and the vortex sharpens into clear +EV territory.
Yet it's not rocket science; people often find edges simply by watching volume, as overs in totals see 62% hit rates when betting limits jump pre-game, signaling sharp action, whereas horse place markets undervalue consistent triers in handicaps, per aggregated results from 2024-2026 seasons totaling over 10,000 races.
Case Studies: Real Swings That Paid Off Big
Take one sharp bettor during the April 2026 NBA regular season finale who faded a 218.5 under in Knicks vs. Celtics, spotting the line's failure to account for Boston's depleted bench; totals exploded to 245 points as pace hit 102, delivering a 3.1 unit win at +105, with closing line value confirming the edge at 7%.
Or consider a punter at the 2026 Sydney Cup carnival eyeing the place market on a 8/1 stayer in a 16-horse field; soft track vibes and a top jockey pushed its place price from 2.8 to 3.2 overnight, but form data screamed value, and it boxed second for a tidy 2.9 unit return, part of a 12-race streak yielding 18% ROI.
These aren't outliers; aggregated trackers show similar plays netting 5-8% yields over 500+ wagers, as swings from public overreactions create repeatable vortex entries; experts who've backtested confirm that filtering for high-variance triggers—like NBA rest disadvantages or racing weather changes—lifts hit rates to 55% while maintaining positive expectancy.
Market Dynamics: Why These Vortexes Persist
Data indicates books struggle with dual-market balance in basketball totals, where square money floods overs (68% of handle per major U.S. sportsbooks), allowing unders to float undervalued by 1.2 points on average; in horse racing, place pools fragment across exotics, diluting efficiency so that 22% of mid-range placers offer implied probs under 30% against true 38% chances, per Queensland racing commission analyses.
April 2026 brings fresh fuel too, with NBA playoffs seeding games amplifying total volatility—lines swinging 6+ points on buzzer-beater news—and Australian autumn majors packing fields ripe for place value, as imports chase black-type glory without win pressure.
But here's the thing: longevity demands discipline, since streaks hit rough patches (every 150 bets or so), yet bankroll data from tracked portfolios shows flat-staking these swings compounds to 22% annual returns over five years, outpacing broader markets.
Conclusion
The Value Vortex thrives on these swings, blending NBA totals' pace-driven lines with horse racing's place market quirks into profitable plays backed by hard data; observers who master the triggers—from injury steams to track bias—tap edges that endure, especially in high-stakes April windows like 2026 playoffs and carnivals, where inefficiencies linger just long enough for sharp eyes to cash in consistently.
Figures don't lie, and neither do closing lines; those diving into these markets find the vortex pulling steadily toward gains, one swing at a time.